

Zabbix vs Checkmk in 2026: Which Monitoring Tool Should You Choose?
Updated October 2026
Zabbix or Checkmk? Zabbix suits teams that want one fully open-source tool that scales across large, mixed estates and can spend time on templates. Checkmk suits teams that want working monitoring quickly, with strong auto-discovery and a simple agent. In the Infrastructure Monitoring Ledger 2026, Zabbix scores 83.4 for capability and Checkmk 79.2.
Zabbix vs Checkmk at a glance
| Topic | Zabbix | Checkmk |
|---|---|---|
| Best fit | Large or mixed estates, teams that want everything open source | Teams that want fast setup and sensible defaults |
| Licence | AGPLv3 since 7.0, no paid-only features | Community under GPLv2; Pro and Ultimate by subscription |
| Cost | Software free; support from EUR 245 a month | Community free; Pro from EUR 190 a month |
| Learning curve | Steeper, templates and triggers first | Gentler start, rules take time |
| Ledger capability | 83.4 out of 100 | 79.2 out of 100 |
| Versions, October 2026 | 7.0 LTS and 7.4; 8.0 LTS planned for Q4 2026 | 2.5 stable, 2.4 oldstable |
Sources: vendor documentation and pricing pages read in October 2026; Infrastructure Monitoring Ledger 2026.
Which is better, Zabbix or Checkmk?
The difference between Zabbix and Checkmk is mostly one of style. Zabbix is a single product where you describe what to collect in templates, items and triggers, and everything is stored in a database you control. Checkmk, which used to be called Check_MK, grew out of Nagios. It finds services on each host for you and is steered mainly through rules.
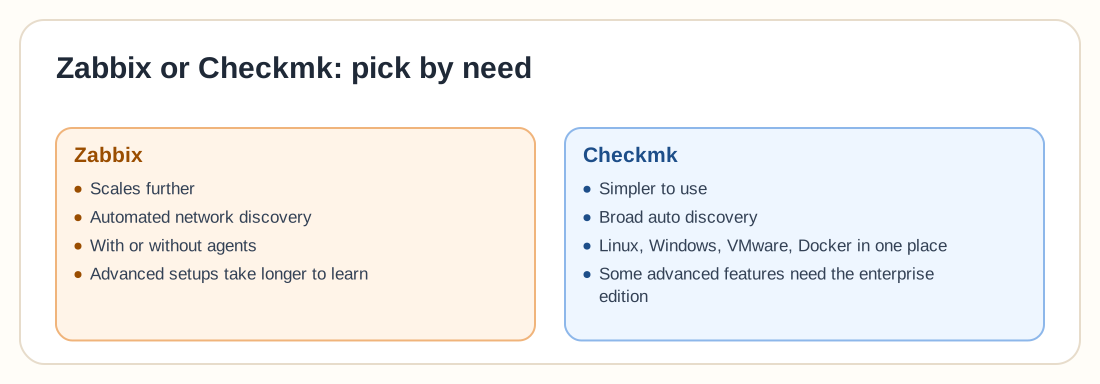
Choose Zabbix if you expect thousands of hosts, want no feature paywall, or already have people who like building templates. Choose Checkmk if you want a useful setup in an afternoon, run mostly Linux and Windows servers, and are happy to pay for Pro once you need more automation. If you are still unsure, the Monitoring Advisor scores both against your own numbers.
Architecture: server, agent, proxy and site setup
Zabbix has a central server that polls and receives data, evaluates triggers and sends notifications, with a web frontend and a database beside it. Agents (or the plugin-based Agent 2) run on monitored hosts. A proxy collects data for the server, buffers it if the link drops and needs its own database. The Ledger records proxy groups with failover and load balancing since Zabbix 7.0.
Checkmk is organised around sites. A site is a complete monitoring instance with its own core, web interface and user, and one server can run several. For several locations you connect remote sites to a central site, which queries them live over Livestatus. Remote sites keep alerting if the link to the centre fails.
Agent based or agentless?
Both do both. Zabbix collects through agents and also through SNMP, IPMI, JMX and VMware checks without one. Checkmk has a small agent secured with TLS, and reads SNMP devices, the vSphere API and cloud APIs through special agents. Checkmk's push mode, where the agent connects outward, is an Ultimate feature, and pull mode works in every edition.
Auto discovery
Checkmk's service discovery is its best-known strength. Open a host in Setup and it works out which checks apply, from the agent output or an SNMP scan, then warns you about new or vanished services. The commercial editions add dynamic host management, which creates hosts automatically from sources such as AWS, Azure, Kubernetes and VMware ESXi.
Zabbix scans IP ranges with network discovery rules, then adds hosts and links templates. Low-level discovery creates items for file systems, interfaces and SNMP tables. It has no edition limits and needs more setup than Checkmk. Zabbix does not discover network topology.
Alerting, notifications and dashboards
Zabbix lets you shape notifications by escalation schedule, recipient and media type, and an action can run remote commands. Its dashboards, graphs and maps are built in. Checkmk notifies through rule chains, and its commercial editions add dashboard widgets and reporting. Version 2.5 rebuilt the dashboards.
In the Ledger the two are level on alerting and on visualisation and reporting, both 4 out of 5. Many teams add Grafana for nicer dashboards.
Learning curve and scalability
Zabbix takes longer at the start, because templates, macros and triggers are the whole model. Checkmk is quicker at the start and gets harder when your rules multiply. On scale the Ledger gives Zabbix 5 out of 5 for data collection and scale and Checkmk 4.
For around 1,000 hosts both are fine. Checkmk's documentation describes a site with 1,205 hosts and 13,555 services on a 10-core server using the Checkmk Micro Core, and says the Nagios core in Community can show high CPU load and slow restarts at scale. Zabbix spreads load with proxies. We have not benchmarked either, so run a pilot.
Open source licence and Checkmk editions
Zabbix is released under AGPLv3 from version 7.0 (GPLv2 up to 6.4) and lists no paid-only features. Checkmk is open core. The Community edition is GPLv2, and the paid editions add features. Checkmk renamed its editions for version 2.5: Raw is now Community, Enterprise is Pro, the self-hosted Cloud edition is Ultimate, and the Managed Services edition is Ultimate with Multi-Tenancy.
| Edition | Formerly | What it adds |
|---|---|---|
| Community | Raw | Free, Nagios core, community forum support |
| Pro | Enterprise | Checkmk Micro Core, Agent Bakery, dashboard widgets, reporting, vendor support |
| Ultimate | Cloud (self-hosted) | Pro plus cloud plug-ins, agent push mode, auto-registration, OpenTelemetry |
| Ultimate with Multi-Tenancy | MSP | Isolated customer sites for service providers |
| Checkmk Cloud | Cloud (SaaS) | Hosted by Checkmk |
Sources: Checkmk docs, editions announcement.
So the old Checkmk Raw vs Enterprise question is now Community vs Pro. You pay for Pro when you want the faster core, central agent management, reporting or support.
Support and pricing
Zabbix software costs nothing. Support is sold in five tiers: Silver (EUR 245 a month, billed annually, online support only), Gold (from EUR 660 a month, with distributed monitoring help), and Platinum, Enterprise and Global by quote. Checkmk Pro starts at EUR 190 a month and Ultimate at EUR 275 a month, both billed annually, on the editions page at about 100 hosts, with price rising with host count. Pro includes 8 by 5 support and Ultimate 10 by 5. Check the vendor pages for current figures before budgeting, as of October 2026.
Current versions, October 2026
Zabbix lists 7.4 (July 2025) as its newest release, with 7.0 LTS supported until June 2027 and 8.0 LTS planned for Q4 2026. Checkmk 2.5.0 came out on 28 April 2026 and is the stable version, 2.4 is oldstable until 28 October 2026 for active maintenance, and 2.3 is in passive maintenance. If you start now, choose Zabbix 7.0 LTS or 8.0 LTS once it ships, and Checkmk 2.5.
Zabbix vs Checkmk for specific jobs
Small business. Checkmk Community gets a small shop monitored fastest. Zabbix is the better pick if you want no edition questions later. Both are free as software.
MSP. Zabbix separates customers with host groups, roles and proxies but has no MSP portal. Checkmk sells Ultimate with Multi-Tenancy. The Ledger scores integrator fit at 16.5 out of 20 for Checkmk and 15.5 for Zabbix. Try the MSP example in the advisor.
Network devices and SNMP. Both support SNMP versions 1, 2c and 3. Checkmk ships nearly 1,000 SNMP check plug-ins picked by a device scan, and Zabbix uses bulk requests and OID discovery. Both score 3.5 out of 5 on network monitoring in the Ledger, and LibreNMS scores 4.
Windows Server. Zabbix has official Windows templates for its agent in passive and active mode and for SNMP. Checkmk installs an MSI agent that registers with a TLS-secured controller. Either works well.
VMware. Zabbix collects from vCenter or ESXi with built-in collectors and discovers hypervisors and VMs. Checkmk reads the vSphere API through a special agent, with nothing installed on ESXi. Both score 4.5 out of 5 for server and virtualisation monitoring in the Ledger.
Kubernetes. Zabbix deploys through a Helm chart with a proxy and agents and uses HTTP templates. Checkmk uses a special agent and cluster collectors, and its Kubernetes dashboards and dynamic host creation are commercial features. Container-native teams often prefer Prometheus with Grafana; see the three-way comparison.
Grafana. Both connect. Checkmk's data source plug-in supports every edition since version 4, and the Zabbix plug-in from the Grafana catalog shows problems and respects Zabbix permissions. More in Zabbix vs Grafana.
Zabbix vs Icinga vs Nagios vs LibreNMS vs Centreon vs Checkmk
The Ledger scores 20 monitoring platforms from public release records. Here are the six that most often sit on the same shortlist as Zabbix and Checkmk. Zabbix has the highest Ledger Index of all 20.
| Tool | Capability (of 100) | Ledger Index (of 100) | Licence | Scorecard |
|---|---|---|---|---|
| Zabbix | 83.4 | 79.4 | AGPLv3 | Read |
| Checkmk | 79.2 | 73.6 | GPLv2 Community, paid Pro/Ultimate | Read |
| Centreon | 78.6 | 73.3 | GPLv2 and Apache 2.0 core, paid editions | Read |
| Nagios XI | 69.4 | 64.6 | Per-node licences; Core GPLv2 | Read |
| Icinga | 67.6 | 64.2 | GPLv2 | Read |
| LibreNMS | 67.6 | 59.1 | GPLv3 | Read |
Source: Infrastructure Monitoring Ledger 2026, edition of 4 October 2026. Capability is the 0 to 100 score for today's product; the Index adds credibility, commercial risk, lock-in, integrator fit and AI leverage.
Zabbix vs Icinga: Icinga is a Nagios-style check engine under GPLv2 with a smaller scope, and scores 2.5 out of 5 on network monitoring. Zabbix vs Nagios: Nagios XI is a proven, older design with per-node licences. Zabbix vs LibreNMS: LibreNMS is the stronger pure SNMP monitor, but covers servers and applications less well and has no commercial support. See Zabbix vs LibreNMS for a school network example and Checkmk alternatives for the wider list.
Best open source infrastructure monitoring tools
For general server and network monitoring, Zabbix, Checkmk Community, Icinga, LibreNMS and Centreon are the open-source options the Ledger scores. Zabbix leads on its numbers. Add Prometheus with Grafana when containers and metrics-first teams are the main audience. The full ranking is in the Monitoring Ledger, and the homelab example shows how a small setup scores.
Zabbix review and Checkmk review
Zabbix: the Ledger praises its public roadmap, regular LTS releases and scale, and notes that flow analysis, configuration backup and topology need other tools. Commercial risk is 3.0 out of 25 and lock-in 4.0, lower being better. Read the Zabbix scorecard.
Checkmk: the Ledger finds the cleanest delivery record of its group and Proxmox monitoring since 2021. The trade-offs are flow analysis that leans on ntopng, no network configuration backup and a new private-equity investor. Commercial risk is 7.5 and lock-in 7.0. Read the Checkmk scorecard.
Migrating between Zabbix and Checkmk
We found no converter documented by either vendor. Templates, triggers and rules do not map one to one, so plan a rebuild rather than an import. Export the host list and groups from the old system, create the hosts in the new one through bulk import or the API, let discovery or templates find the checks, recreate the alert rules, and run both systems in parallel until the alerts agree. The same steps work in either direction.
FAQ
Is Zabbix or Checkmk better?
Neither wins everywhere. Zabbix scores higher in the Infrastructure Monitoring Ledger 2026 (83.4 capability, 79.4 index, against 79.2 and 73.6 for Checkmk) and has no paid-only features. Checkmk is quicker to get running and its discovery needs less hand work.
What is the difference between Zabbix and Checkmk?
Zabbix is one open-source product built around templates, items and triggers stored in a database. Checkmk grew out of Nagios, discovers services per host and is configured mainly through rules, with a free Community edition and paid Pro and Ultimate editions.
Is Zabbix free?
Yes. Zabbix is released under AGPLv3 since version 7.0 (GPLv2 before), and Zabbix lists no paid-only features. You pay only if you want vendor support, which starts at EUR 245 a month for Silver, billed annually.
Which Checkmk edition do I need?
Community is enough to try Checkmk and for small estates. Pro adds the faster Checkmk Micro Core, the Agent Bakery, reporting and vendor support, and Ultimate adds cloud and OpenTelemetry features. Pro starts at EUR 190 a month, billed annually, on Checkmk's editions page.
Which is easier to learn, Zabbix or Checkmk?
Checkmk is easier for the first week, because service discovery finds the checks for you. Zabbix asks you to understand templates, macros and triggers first, which pays back later in larger setups.
Which handles 1,000 hosts better?
Both are used at that size. Zabbix has proxies and proxy groups for spreading load, and Checkmk's own documentation reports sites with over 1,200 hosts on its commercial core. On Checkmk Community the Nagios core is the part to watch.
Can I migrate from Zabbix to Checkmk, or back?
We found no one-click converter documented by either vendor. Most teams export the host list, rebuild groups, templates or rules by hand, and run both systems side by side until the alerts match.