

Newsletter
Subscribe our newsletter
Get new infrastructure guides, comparison reports, and migration notes in your inbox.
Zabbix Enterprise Monitoring and Alternatives
How Zabbix enterprise monitoring works, what Zabbix 7.0 LTS adds, and how it compares with Prometheus, Nagios and Datadog
Introduction to Zabbix
Zabbix is enterprise-level software for real-time monitoring of millions of metrics collected from tens of thousands of servers, virtual machines and network devices. It has been in development since April 2001, and over those two decades it has become a mature platform known for its scalability, flexibility and cost-effectiveness.
Many contemporary tools specialize in a single niche. Zabbix positions itself as a "single pane of glass" solution that covers the whole monitoring spectrum, from deep hardware metrics (fan speeds, temperature sensors) and network utilization to high-level application states and cloud services.
Open source philosophy: "Freedom Without Boundaries"
Zabbix is released only under the GNU Affero General Public License version 3 (AGPLv3). Unlike "Open Core" competitors, it has no "Enterprise Edition", so every feature, including the most advanced capabilities in Zabbix 7.0 LTS, is in the standard package. The company earns its revenue from professional services, training and consultancy.
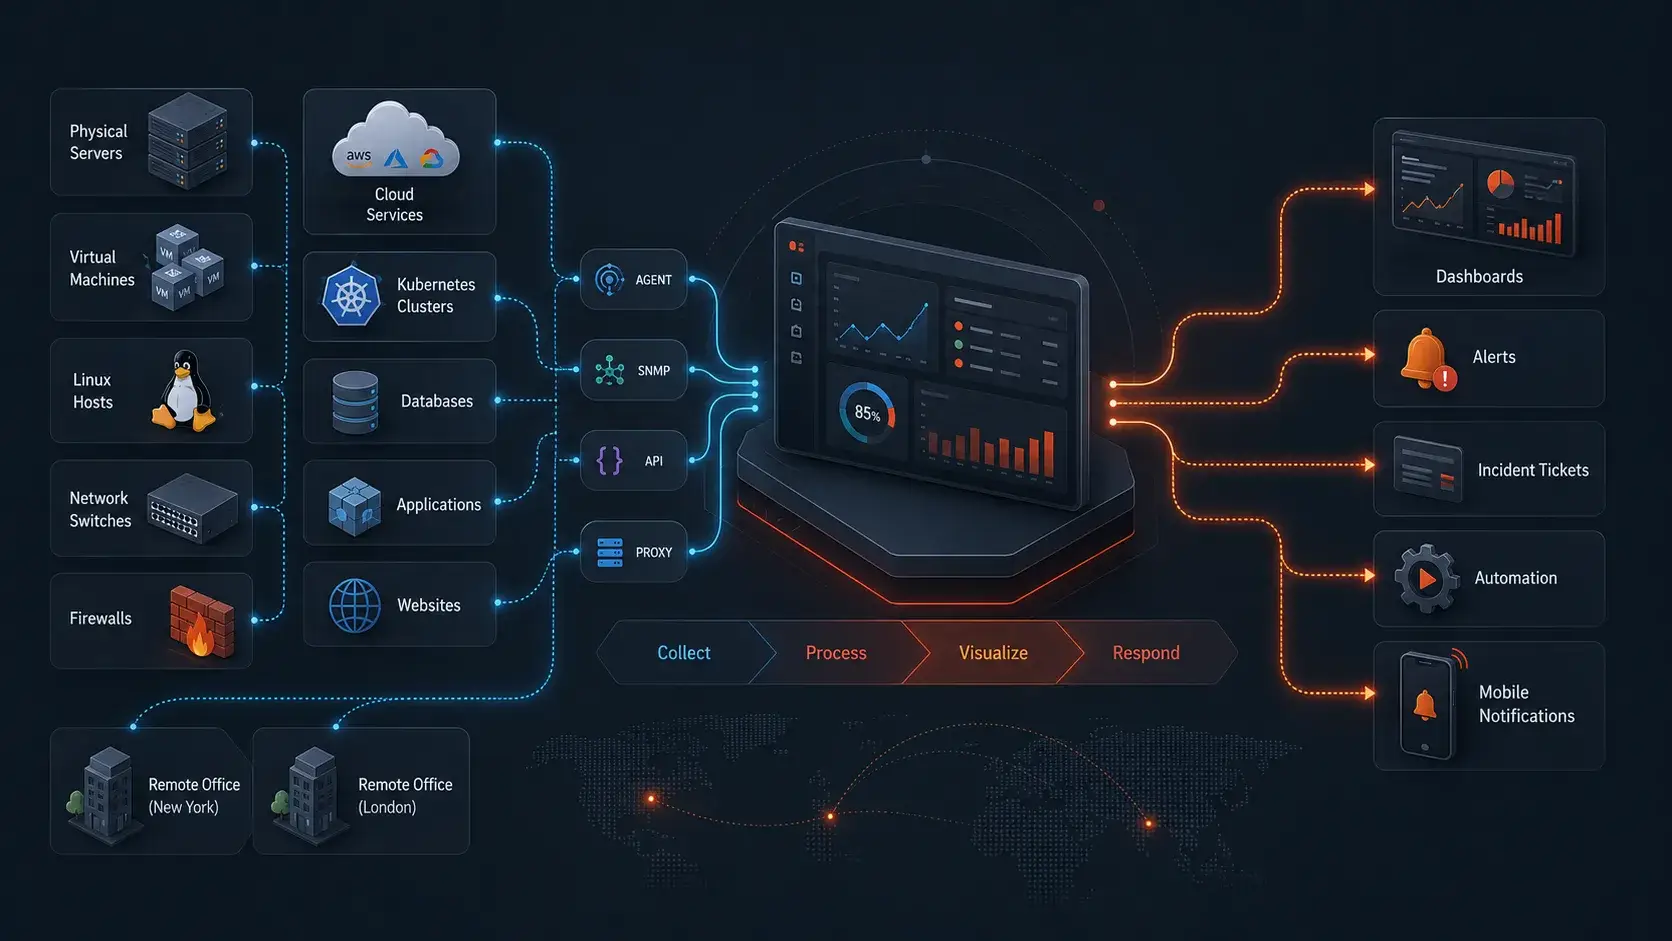
Core Architecture
Click a component to see its role in the monitoring system
Select a component to view details
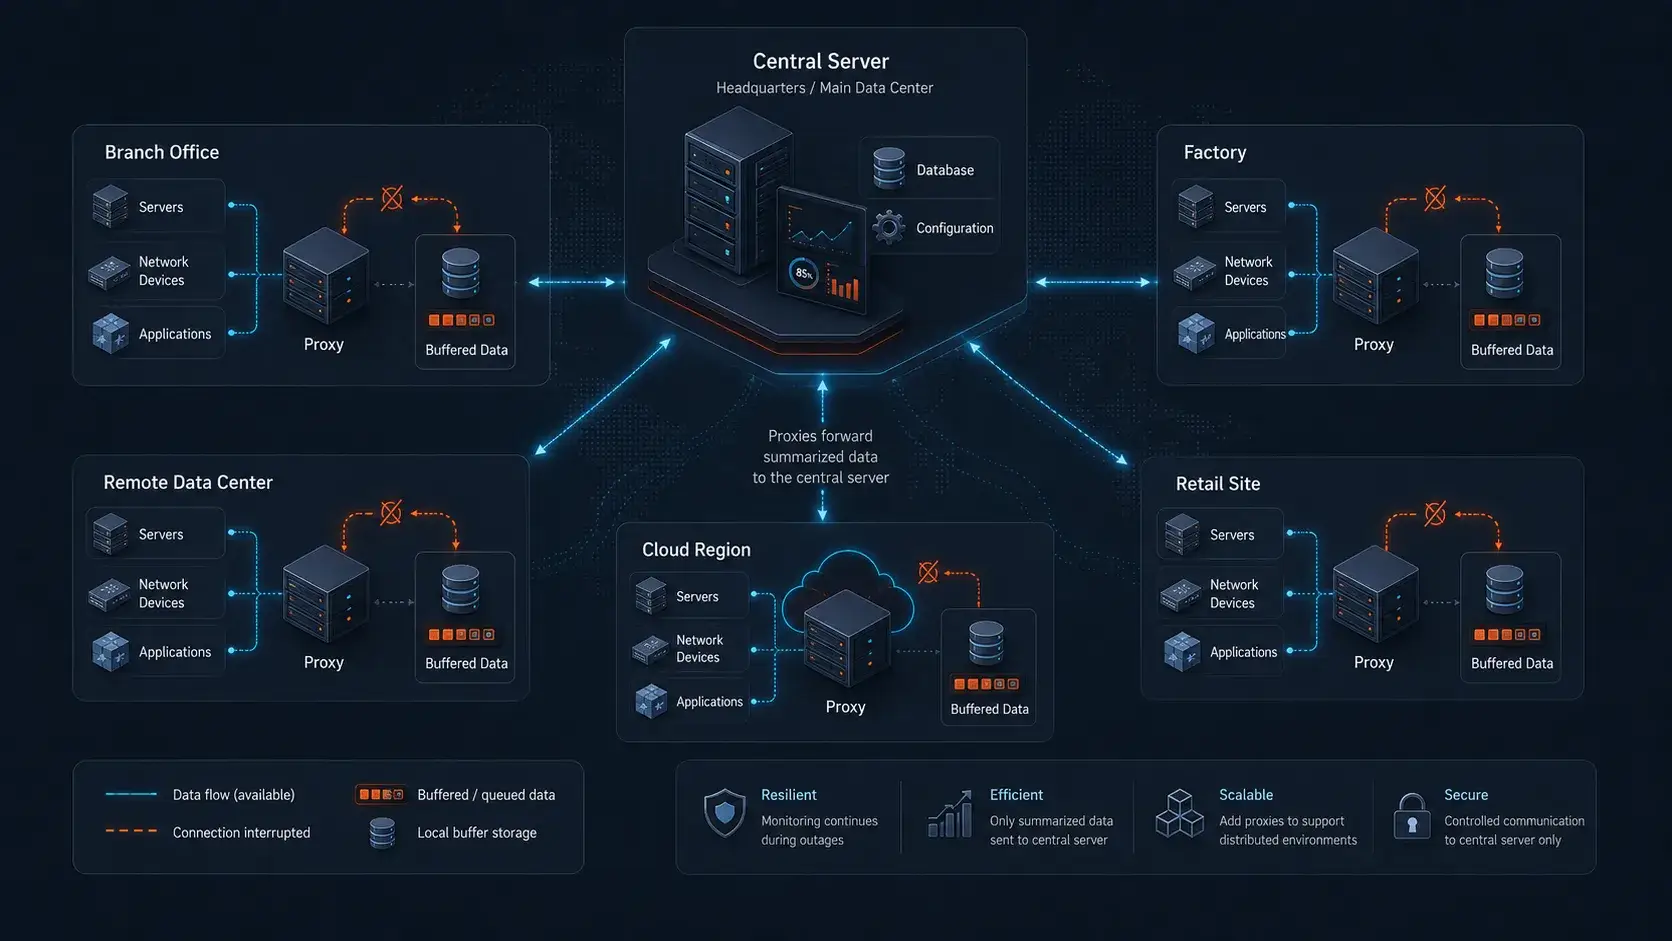
Major new capabilities
The main features of the Zabbix 7.0 Long Term Support release
Asynchronous Pollers
A single poller process handles up to 1,000 concurrent checks, which greatly improves throughput.
Browser Item (Synthetic Monitoring)
Full Selenium-based synthetic monitoring with real browser automation for user journey testing.
Proxy Load Balancing
Proxy Groups distribute hosts automatically and fail over, giving the monitoring layer HA.
Centralized Timeouts
Manage timeouts globally via GUI/API. Override per proxy or item without agent reconfiguration.
Honeycomb Widget
High-density visualization showing thousands of hosts/containers in a single view.
Native MFA
Multi-Factor Authentication built into the platform for enterprise compliance.
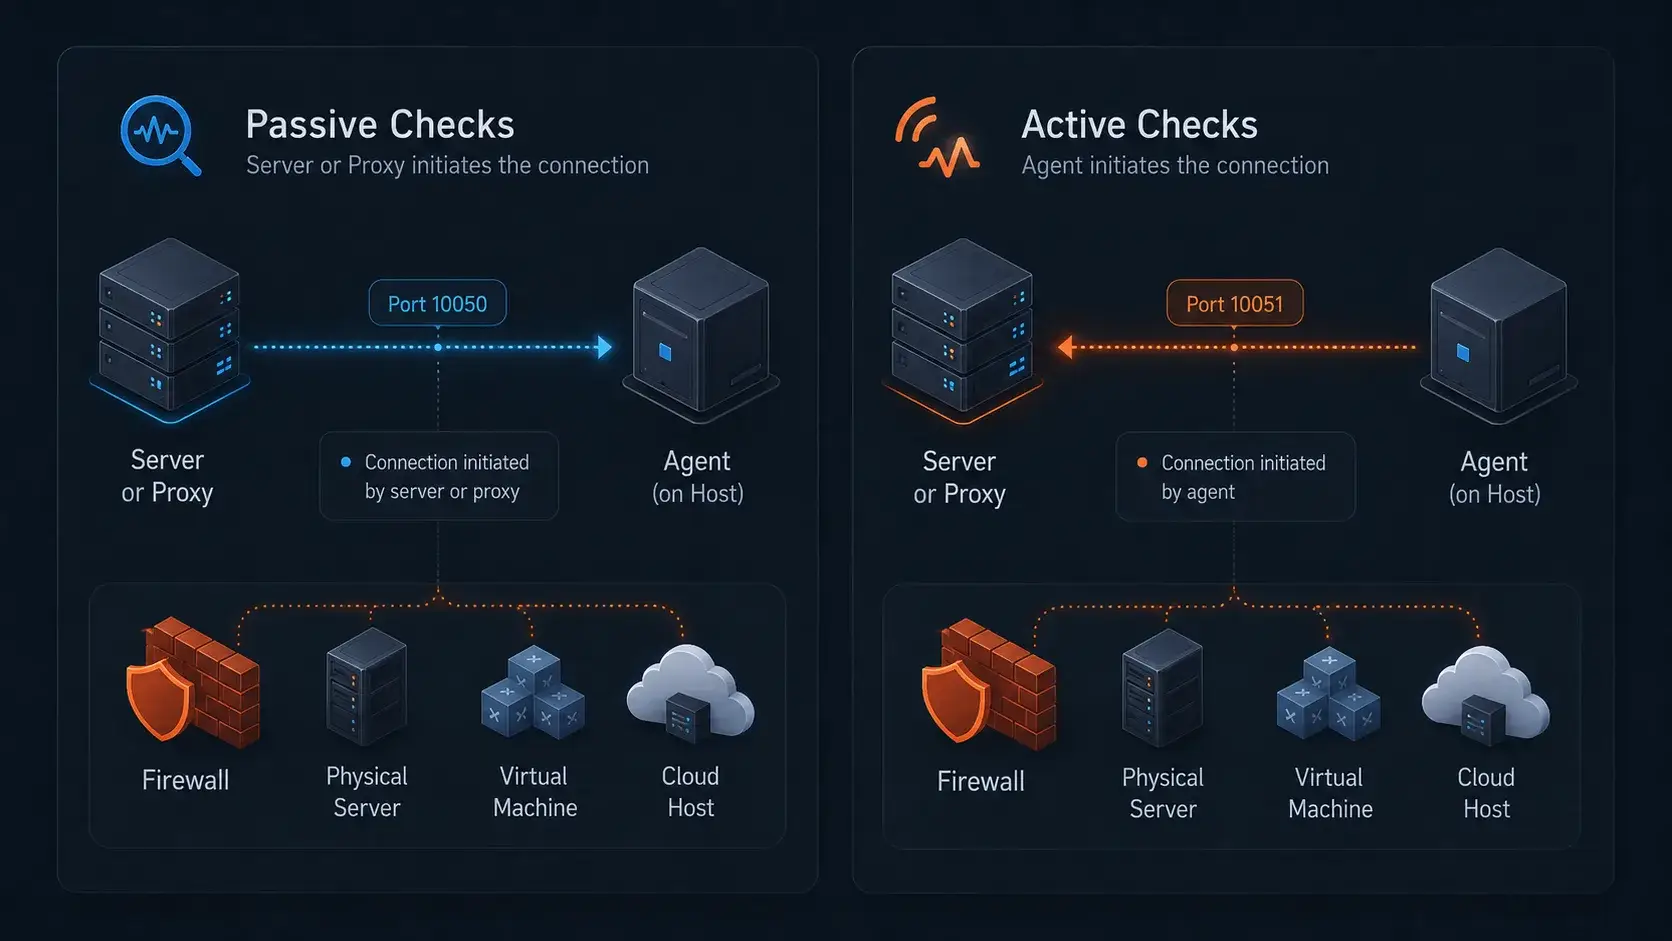
Active vs passive monitoring modes
The difference matters for network configuration and firewall management
| Feature | Passive Checks | Active Checks |
|---|---|---|
| Direction | Server connects to Agent | Agent connects to Server |
| Initiator | Zabbix Server/Proxy | Zabbix Agent |
| Request | Server asks: 'Give me value for Key X' | Agent asks: 'What items should I monitor?' |
| Firewall | Port 10050 open on Agent side | Port 10051 open on Server side |
| Use Case | LAN environments, strict server control | Cloud, NAT, unstable networks, laptops |
| Load | Higher load on Server (poller processes) | Lower load on Server (trapper processes) |
Operational note: In modern cloud environments, where targets often sit behind auto-scaling groups or NAT gateways, Active Checks are the preferred method. The agent can "phone home" without an inbound firewall rule on the monitored host, which makes network security configuration much simpler.
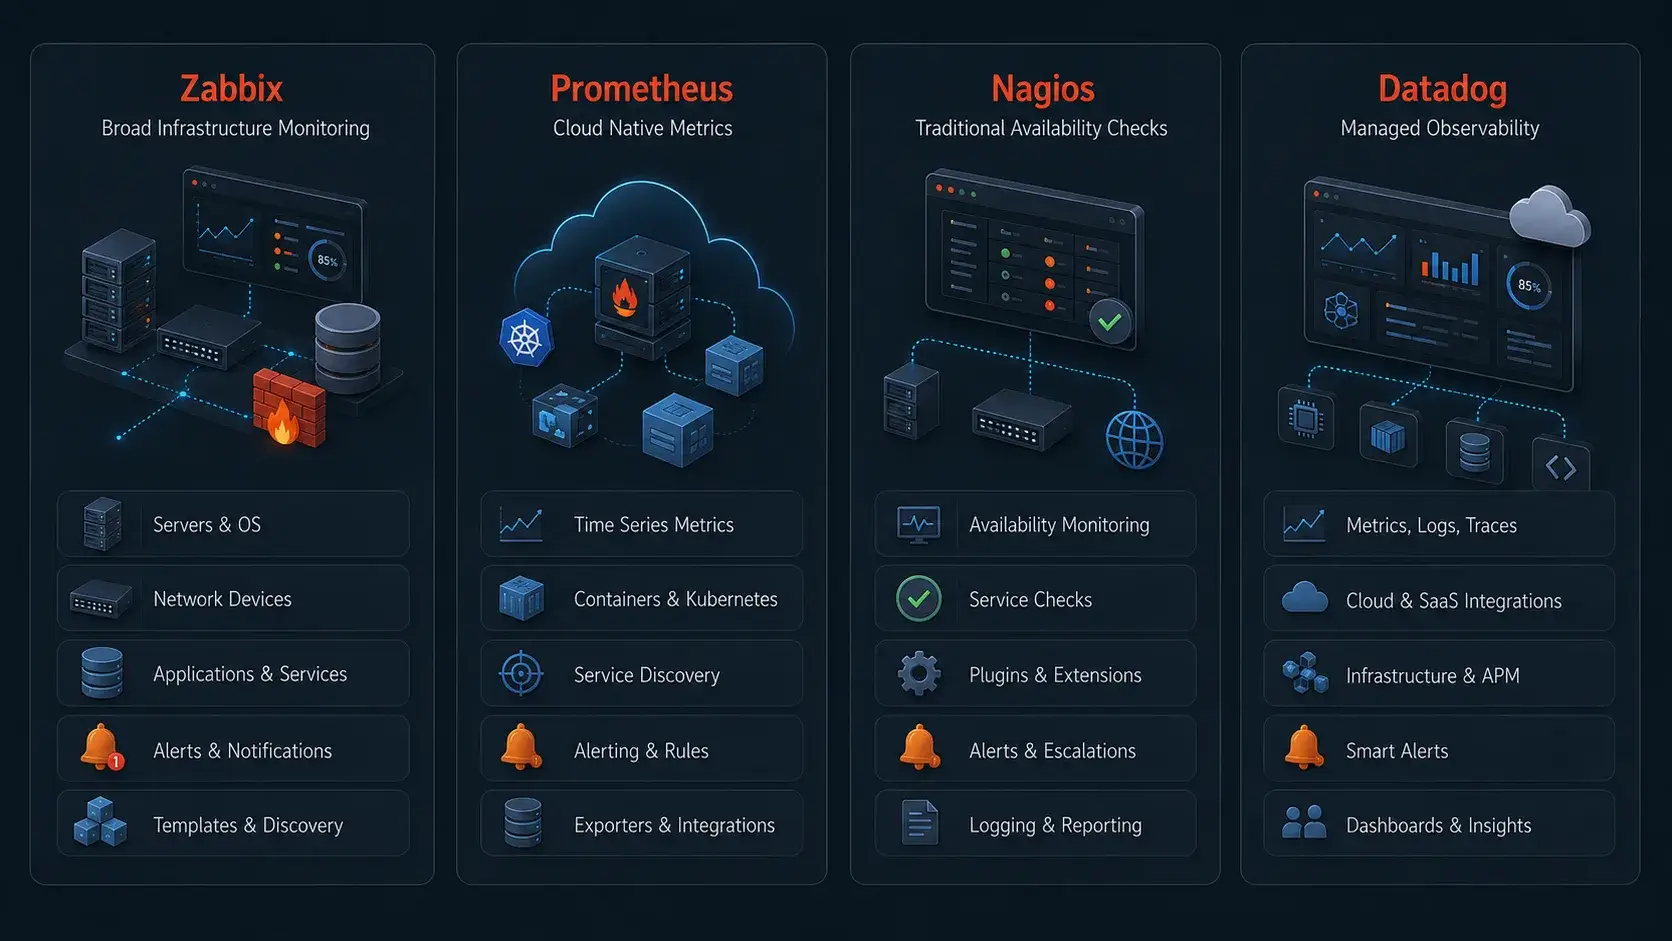
Competitive comparison
Trade-offs between different monitoring approaches
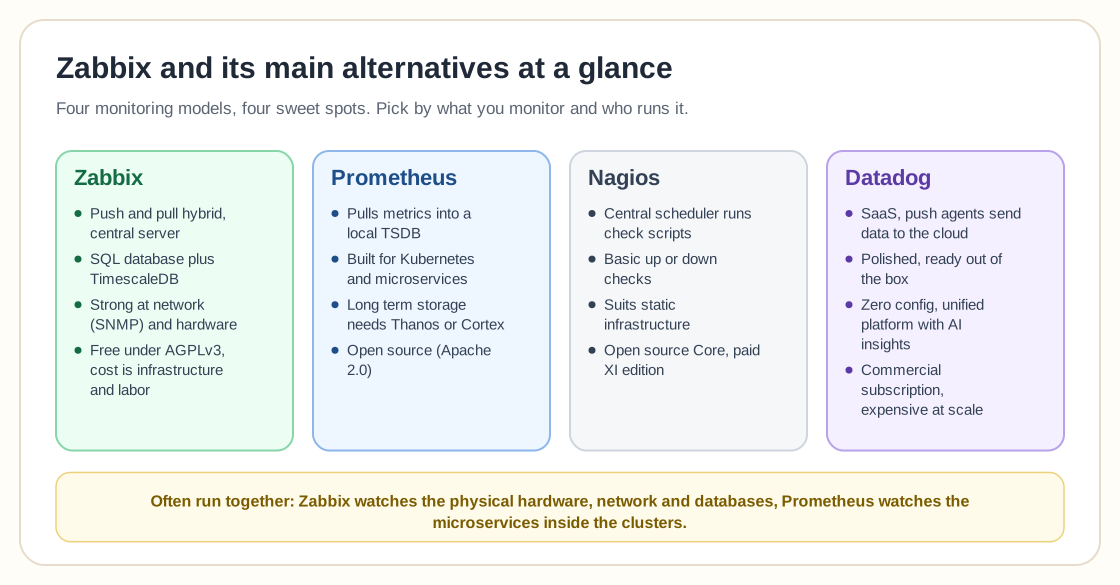
| Feature | Zabbix | Prometheus | Nagios | Datadog |
|---|---|---|---|---|
| Model | Push/Pull Hybrid: Centralized server with SQL DB | Pull: Decentralized, scraping metrics into local TSDB | Active Check: Centralized scheduler executing scripts | SaaS: Push agents sending data to cloud |
| Primary Strength | Versatility: 'Pet' & 'Cattle' monitoring, Network (SNMP), Hardware | Cloud-Native: Kubernetes, microservices, high-cardinality data | Simplicity: Basic up/down checks for static infrastructure | Observability: AI/ML insights, zero-config, unified platform |
| Data Storage | Relational (MySQL/PG) + TimescaleDB. Strong consistency | TSDB. Optimized for recent data, difficult long-term | Flat files or RRDTool. Performance data often discarded | Cloud proprietary storage |
| Visualization | Strong native dashboards + Grafana plugin | Basic UI. Relies almost entirely on Grafana | Very basic/Outdated | Best-in-class, highly polished |
| Licensing | 100% Free (AGPLv3). Cost is purely infrastructure/labor | Open Source (Apache 2.0) | Open Source Core / Paid 'XI' Enterprise version | Commercial subscription (Expensive at scale) |
API and integration ecosystem
JSON-RPC 2.0 based API for programmatic control of all system aspects
API Structure
All API requests are HTTP POSTs to api_jsonrpc.php. Authentication returns a hash that must be included in subsequent requests.
{
  "jsonrpc": "2.0",
  "method": "history.get",
  "params": {
    "output": "extend",
    "history": 0,
    "itemids": "1001",
    "sortfield": "clock",
    "limit": 10
  },
  "auth": "0424bd59b807674191e...",
  "id": 1
}
Webhook Integration
Zabbix Webhooks are JavaScript scripts that exchange data in both directions with ticketing systems.
- Send alerts to Jira, ServiceNow, PagerDuty
- Parse response and update Zabbix event with Ticket ID
- Auto-close tickets when Zabbix problem resolves
- Automate host provisioning from AWS EC2/Azure VMs
Security and administration
Encryption
Full TLS encryption between all components using CA-signed certificates or Pre-Shared Keys (PSK).
Secret Management
Integration with HashiCorp Vault and CyberArk for dynamic credential retrieval.
RBAC Permissions
Role-based access with User, Admin and Super Admin types. Access is granted at the Host Group level.
Conclusion
Zabbix is a leading open source enterprise monitoring platform. It balances deep technical visibility into legacy infrastructure (via SNMP, IPMI, Agents) with the requirements of modern cloud-native environments (via HTTP, Prometheus integration, Kubernetes discovery).
Zabbix 7.0 LTS is a major release for the platform. The move to asynchronous polling removes earlier performance ceilings, so a single cluster can monitor millions of metrics. It needs more configuration work up front than SaaS alternatives, but few tools match its mix of flexibility, control and long-term cost efficiency.
For organizations that want a "freedom without boundaries" approach to observability, Zabbix is still the strongest choice.
Explore the full monitoring comparison cluster
Every head-to-head and alternatives guide we've published on Zabbix, LibreNMS, Checkmk, Prometheus and the other network and infrastructure monitoring tools.